Our Klamath Basin Water Crisis
Upholding rural Americans' rights to grow food,
own property, and caretake our wildlife and natural resources.
Our Klamath Basin
Water Crisis
Upholding rural Americans' rights to grow food,
own property, and caretake our wildlife and natural resources.
|
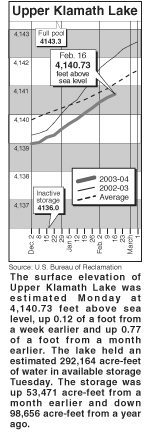
What happened to the plan to fill the lake? Lakes, rivers, snow, H&N 2/18/04
Published Feb. 18, 2004 Lake levels Clear Lake - Clear Lake's surface elevation was estimated Monday at 4,522.96 feet above sea level, with storage at 72,760 acre-feet, down 33,980 acre-feet from a year ago. Gerber Reservoir - The surface elevation of Gerber Reservoir was estimated Monday at 4,810.94 feet above sea level, with storage at 19,221 acre-feet, down 6,095 acre-feet from a year ago. River flow Following are daily averages of the volume of water flowing at key points in the Klamath Basin, measured in cubic feet per second: Link River 2004 2003 Feb. 10 738 590 Feb. 11 699 701 Feb. 12 752 519 Feb. 13 720 467 Feb. 14 932 459 Feb. 15 999 460 Feb. 16 573 460 Klamath River at Keno Dam Feb. 10 898 599 Feb. 11 954 801 Feb. 12 952 782 Feb. 13 961 704 Feb. 14 1,161 755 Feb. 15 1,214 599 Feb. 16 917 593 Klamath River at Iron Gate Dam Feb. 10 1,319 947 Feb. 11 1,312 815 Feb. 12 1,319 757 Feb. 13 1,319 773 Feb. 14 1,319 768 Feb. 15 1,312 778 Feb. 16 1,530 783 The U.S. Bureau of Reclamation's operations plan calls for minimum flows of 1,324 cubic feet per second from Iron Gate Dam on the Klamath River during the month of November. Net inflow to Upper Klamath Lake Feb. 10 1,440 1,369 Feb. 11 1,401 1,091 Feb. 12 1,454 1,688 Feb. 13 1,071 1,636 Feb. 14 1,283 2,018 Feb. 15 1,350 1,629 Feb. 16 2,328 1,629 Williamson River below Sprague R. 2004 Avg. Feb. 18 945 1,070 Source: U.S. Bureau of Reclamation, U.S. Geological Survey, Oregon Water Resources Department. Snow report Following are today's estimates of the water equivalent measured in inches in the snowpack at selected sites in Southern Oregon and Northern California. Site Water Avg. Pct. of content avg. Adin Mountain 14.4 10.8 133 Billie Creek Divide 29.3 19.8 148 Cedar Pass 18.0 13.9 129 Chemult Alternate 10.8 7.9 137 Cold Springs Camp 33.9 25.0 136 Diamond Lake 15.6 13.4 116 Dismal Swamp 29.2 21.4 136 Quartz Mountain 2.2 2.2 100 Sevenmile Marsh 38.4 24.3 158 Silver Creek 12.8 9.0 142 Strawberry 7.0 5.4 130 Taylor Butte 9.8 6.1 161 Klamath Basin pct. of avg. 138 Goose Lake Basin pct. of avg. 130 Source: National Resource Conservation Service

|
Home
Page Updated: Thursday May 07, 2009 06:14 AM Pacific
Copyright © klamathbasincrisis.org, 2004, All Rights Reserved