Our Klamath Basin Water Crisis
Upholding rural Americans' rights to grow food,
own property, and caretake our wildlife and natural resources.
Our Klamath Basin
Water Crisis
Upholding rural Americans' rights to grow food,
own property, and caretake our wildlife and natural resources.
|
http://www.heraldandnews.com/articles/2005/06/10/news/water/water.txt Lakes, rivers
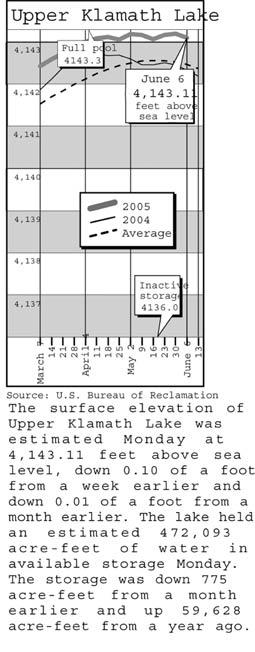
Lake levels Gerber Reservoir - The
surface elevation of Gerber Reservoir was estimated
Monday at 4,820.98 feet above sea level, with
storage at 45,220 acre-feet, up 4,050 acre-feet from
a year ago. Following are daily averages
of the volume of water flowing at key points in the
Klamath Basin, measured in cubic feet per second: June 4 1,530 1,155 June 5 1,370 957 May 31 407 565 June 2 492 595 June 4 500 582 June 6 518 662
|
Home
Page Updated: Thursday May 07, 2009 09:14 AM Pacific
Copyright © klamathbasincrisis.org, 2005, All Rights Reserved